
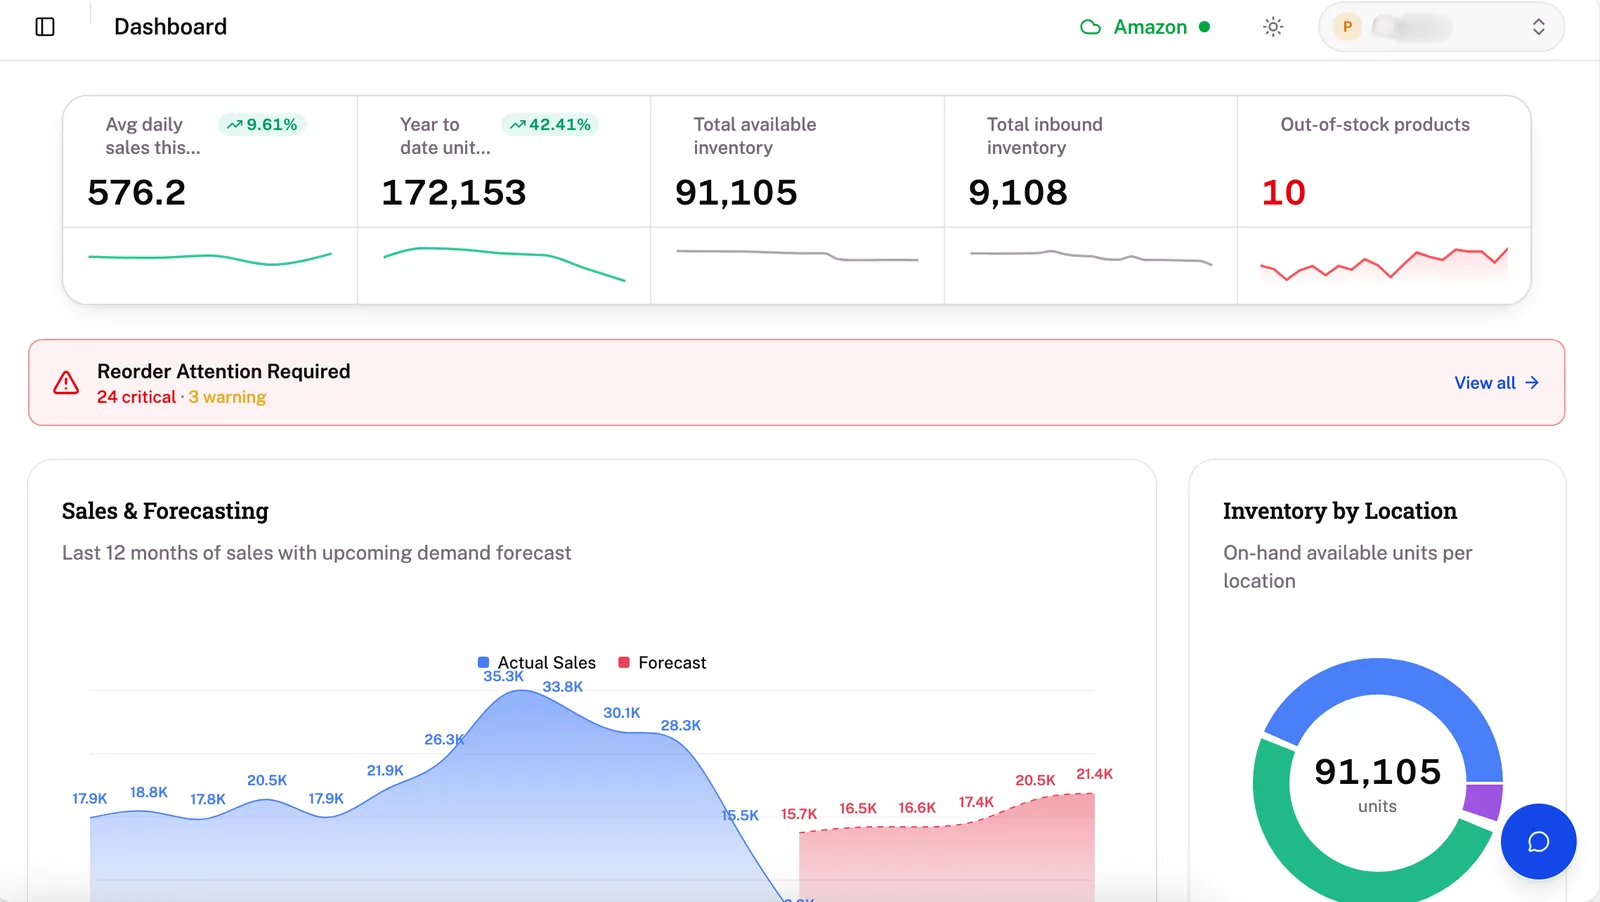
Why Historical Sales Data Isn't Enough for Q4 Demand Forecasting
For e-commerce brands and Amazon FBA sellers, Q4 is the real test. Between Black Friday, Cyber Monday, and the holiday rush that follows, this one quarter can make up to half of a brand's entire annual revenue.
So when it's time to plan for that surge, most sellers do the same thing: pull last year's Q4 numbers, tack on an optimistic 15% growth assumption, and place the PO.
That approach has a fundamental flaw. Forecasting off historical data alone is like driving while only checking the rearview mirror. You're reacting to a road that's already behind you. Here's why last year's numbers can't carry this year's Q4, and what should be driving your forecast instead.
The Problem With Just Looking Back
Historical sales data tells you what happened under conditions that no longer exist. Lean on it too heavily for Q4 planning, and you're ignoring some real blind spots:
The economy has moved. Inflation, consumer credit, and disposable income all shift year to year. What people spent on impulse buys last November isn't a guarantee of what they'll spend this year.
Amazon's algorithm and ad costs don't sit still. The A9 algorithm changes, and so does PPC pricing. If your CPC doubles this Q4. Your traffic and conversions are going to look nothing like last year's.
Stockouts lie to your data. Suppose you were out of stock for 10 days last November. Your historical numbers show a demand dip that never actually happened. It was a supply problem, not a demand problem. Forecast off that dip, and you'll walk straight into another stockout.
What Your Q4 Forecast Actually Needs to Account For
Avoiding both holiday stockouts and January deadstock means building a forecast that moves with real conditions, not last year's spreadsheet. That means factoring in:
Promotional Lift
A 20%-off Lightning Deal doesn't just boost sales. It reshapes your entire daily velocity curve. You need to know the actual multiplier each discount tier creates against your baseline, not guess at it.
Micro-Seasonality
Trends move faster than they used to. A product going viral on social media, or a competitor slipping out of the top search results, can shift demand within weeks. Your forecast should weight the last 30 days more heavily than what happened a year ago.
Supply Chain Volatility and Lead Times
None of this matters if your stock is stuck at the port. A real Q4 model has to account for longer holiday freight times, peak-season surcharges, and factory delays. Adjust your safety stock accordingly.
How A2Z Supply Chain Forecasts Q4 (Without a Spreadsheet in Sight)
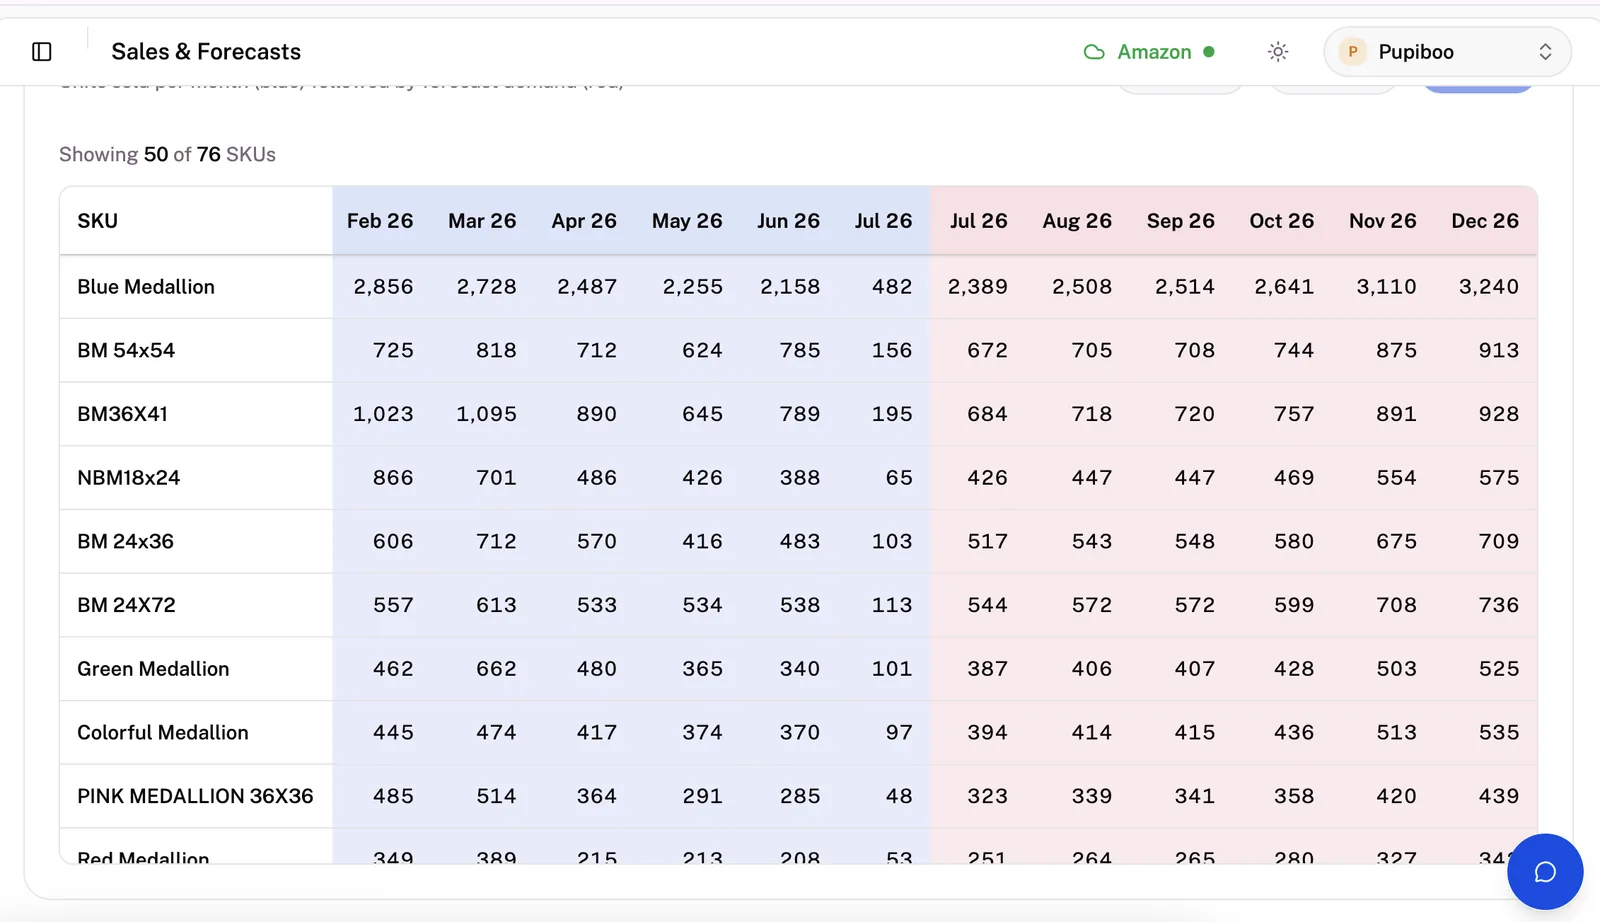
This level of detail isn't something you can track manually. It's why A2Z Supply Chain replaces guesswork with math. Using a proprietary ERP and dedicated logistics teams to manage holiday scaling end-to-end:
ML-driven forecasting: Our models process sales history, real-time seasonality shifts, and planned promotions to tell you what to order, down to the unit.
Dynamic reorder points and allocation: Reorder points and safety stock adjust automatically as Q4 ramps up, so you're not tying up cash early or missing a peak sales window.
End-to-end supplier coordination: We manage POs, lead times, and production schedules directly with your factories, and coordinate inbound freight, 3PL routing, and FBA cross-docking. So your product lands in Amazon's fulfillment centers before the peak-season cutoffs.
At the end of the day, you shouldn't have to build a Q4 forecast yourself. A2Z Supply Chain can manage the entire process for you. On our own proprietary ERP, so you get a genuinely accurate forecast instead of an educated guess. You see real-time data on every SKU, every shipment, and every reorder point as it happens. That visibility is what drives higher sell-through and stronger margins going into peak season.